DevOps and Telemetry: Insights into your application
I like to make work and performance visible for teams by giving them the necessary information to gauge the performance of a system, both on a daily basis as well as over time. This will help them to find less performant parts of the system, or checking engagement statistics. Sometimes I feel this part of the process is forgotten when talking about DevOps these days. People will focus on bringing the different teams together, create vertically oriented teams and changing the static mindset into ‘the DevOps mindset’.
In my opinion, telemetry Is a very important part into the DevOps journey. Without it, it’s hard to prove anything: whether it is the effectiveness of your organization into rolling faster, or checking usage statistics on new features. Step one should be to get a solid understanding of (a lot of different aspects of) your application.
This series of posts will go through my own journey in this aspect of DevOps.

When I was the team lead for a multi-tenant SaaS product we hosted for our customers, I made sure we enabled our product owner, management and the dev team to get important insights in the availability, performance and usage of our systems.
As we followed the adagio: ‘You build it, you run it’, I made sure it was possible to view the current (near real-time) performance on a dashboard and more business information on a daily basis, like the number of (new/recurring) users inside a Business Intelligence product. We even tracked supporting systems to make sure everything was up to our standards (think e.g. of SSL certificates via SSLLabs for validity and key strength), SAS Key validity and more.
Series
- Part 1 - My journey with telemetry and starting with logging
- Part 2 - Supporting systems and how to gather that information (this post)
- Part 3 - Supporting the support systems
Part 1 in the series
In this first post I’m exploring the information I found necessary to have and will follow this up in another post with several methods to gather that information. The closing part of this series will be an overview of tools that could be use to gather the necessary information and display inside of a dashboard.
System
I’ll base all examples in this series on a multi-tenant SaaS application, which was build with ASP.NET MVC. We hosted that application in Azure on an App Service Plan, making use of SQL Database, blob storage (blob/table and queues), key vault and more.
Part 1
What information do you need to check?
Are we up?
Maybe the first information we started gathering was information about the incoming requests to the web application: raw number of requests and request errors, together with information like server side duration, user agent, request path, tenantid and userid.
 At first we gathered this information by just logging it into the database after a request was ended, but after a while we learned that this was putting quite a load on our database, locking tables on inserts and live checking them in production is not a great idea: performance will tank if you have a small database tier and > 800k entries in the table per month. We could start to shard that table, but even then it would still be a performance issue with our growing customer and user base. Remember, inserting new records in that table will lock it and new insert will have to wait.
We decided to test and later implemented logging that same information into table storage, with a sensible keying strategy that would effectively shard that information inside the table storage. That way, inserting and reading that data would no longer hit our database performance.
This information could be loaded into our reporting engine without drawing any performance on our database, which was a big plus for us. Since loading the data from table storage was also fast, we could load it on demand to generate new reports & check performance issues on the fly (e.g. to see if it was an issue for one user, one tenant or all users).
Issue with this method
Regularly loading and testing this information proved us that the system was running in a normal way, but we only saw that the application wasn’t available to the end user if there was limited or no data available: it will then take a while to see what the cause is and perhaps you didn’t even notice that the information was lacking if you aren’t checking for the volume of new data. You might even NOT notice anything, because you might think that there are less or no active users using the application!
Next step - rolling our own solution
We then started with the search for a monitoring platform to test the availability of the application by testing the login page. Since the login page (usually) doesn’t actually hit the database, we even implemented a specific endpoint in the application that would check to see if the database was available and up to date with the latest schema. Of course, all other elements of the application (blob storage with its own parts, key vault, etc.) would also have to be checked, which could lead us into creating a performance bottleneck in our own system if we’d hit that endpoint a lot. Nevertheless, because we already had such a monitoring solution in place, we added a web job to it that we could configure with url’s to check for at least a HTTP OK (200) result on that endpoint. When a couple of checks would fail, the system would trigger an email to the admins, telling them to start their analysis on the system. We figured that having a solution in place would be better than none. In the mean time, we’d search for a better way to monitor the system.
A better way (for us)
Since rolling your own solution can take quite some time to get things right, we also looked into other available ways to get the necessary insights into our application. Since we where running on Azure, and even with ASP.NET, implementing Application Insights was a low friction step. These days, you can start by adding Application Insights as an extension to your web app, so without even changing the code, but back than we had to just implement the NuGet package and add our telemetry key to our configuration. Adding two or three lines of code in both ASP.NET and a central JavaScript location and we where up and running.
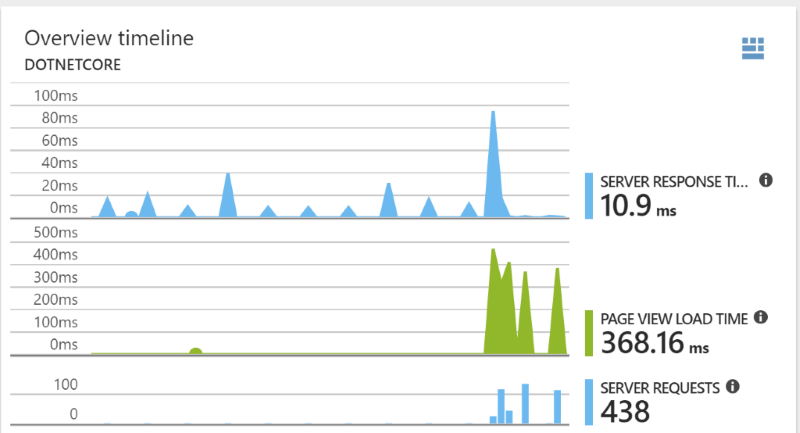
After the next rollout, we were gathering the (basic) data so that Application Insights could give us:
- Easy and high level tracking of the performance of our application.
- Finding errors in both our own requests, but also to our dependencies like SQL server, blob storage, key vault, etc.
- A very easy way to initiate alerts to our admins: even adding sending an email to a distribution group is a simple way to get started.
With this information available, we created dashboards inside the Azure portal that we’d share between the team members that had access to the Azure subscription.
Since we didn’t add any additional data into Application Insights like tenantId or userId for better correlation to those levels, we needed to rely on Application Insights way of calculation user and session counts. Since these are gathered based on application insights own methods, we saw a difference with our own unique user counts. Application Insights would see a user logging into a different browser or device as a new user/session and count it thusly. Without a userId, it couldn’t relate the information back to the same user (of course!).
Next step: log additional information
The next step would be to add that missing information into Application Insights, as well as any specific activities we would like to track. You can think about actions like adding/deleting a product to a basket, (not) paying for the items, etc. These items can then be used inside reporting. Information about adding this information can be found here.
Next step: long term data retention
After getting some trust in the information (checking it with our own logs), we can then start using the information of Application Insights into our Business Intelligence platform (just pick one that’s available to you and you can actually work in) and provide information about our application over a longer period of time. The Application Insights dashboards inside of the Azure portal would usually be shown for the last hour and the last week. If you want to track usage over a longer period of time, you’ll need to export it and use it in another place. One way to do so is exporting the logs into a SQL database and then consuming that data into a dashboarding solution of your choosing.
A way to do so into Power BI is described here.
Next up:
The next post in this series will be: ‘Part 2 - Supporting systems and how to gather that information’. I think it could be helpful to have a (start of) a list of items I started tracking about supporting systems. What parts of your infrastructure does an ‘Ops’ team really care about? I’ll dive into that in the next post, which you can find here.