DevOps Maturity Levels - Continuous Integration
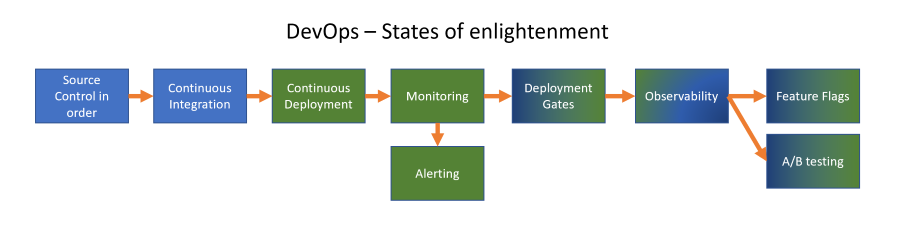
If you have proper source control in place, you have a central location that holds the source code. From that location you can start with Continuous Integration as a next state of enlightenment in your DevOps way of working. Check that link for posts on the other topics.
Continuous Integration (CI)
With continuous integration we mean doing something with each incoming change to the central source code location that verifies that things still ‘work’ as intended. For an application, this could mean building the source code and verify that you have everything you need to build it. This prevents ‘it works on my machine’ that you hear in teams that don’t have a central build environment to do these checks. Finding out what is causing an issue between a deployment and your local developer environment can be hard that way.
By having a central location (or server) that starts doing things to verify code changes you prevent a lot of issues: you make sure all changes needed to create a ‘build’ are checked in and that the code is not just working because it could be build on a developers machine.
There are multiple aspects of Continuous Integration that can be viewed as different maturity levels for a teams way of working. For me, the logical process to add them is listed below:
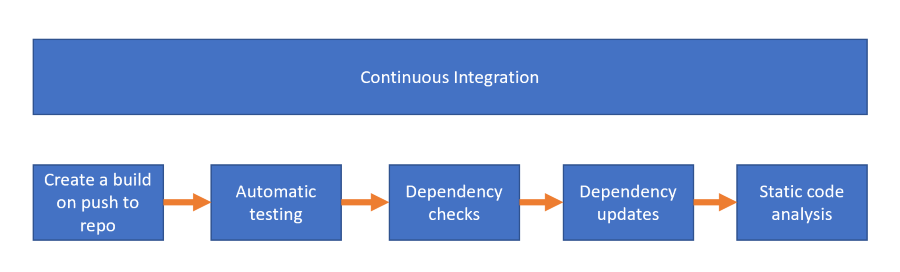
Create a build on changes
The first thing to create when improving your DevOps way of working is to create a CI build: the idea of a build is to create an artefact: this can be a zip file that can be deployed onto a webserver for example.
By automating the steps to create the build you are already moving a way from the ‘works on my machine’ syndrome some developers have 😀. Setting the CI build up on a server designated specifically for builds will make sure that any changes made to the source code can actually be build.
At the end of the build, the results are stored on the build server (or uploaded to the cloud, or a release location) and labeled with a version number (usually the date with a incremental number for that date or by using date + time).
We call this process a build pipeline: a set of tasks that can be run to execute the steps to verify the build.
Only deploy build artifacts
The next step is to agree with you team that the only code that is being deployed is coming from the build server as artifacts! No more copy and pasting files from a developers machine. (yes, I’ve seen teams doing that, with all the consequences of not having reliable deployments since you could not find with what code that file was created).
Build for any change
Make sure you run the build on any change that comes in! You can have different builds: one for verification (the code can be build) and one for creating the actual artefact to be deployed.
If you are using feature branches, build the incoming changes on those branches as well as on the main branch of your code. Of course, you can setup the artefact creation to only run on the main branch, to prevent someone from deploying an artefact from a feature branch. Later on, you could create a new test environment based on a feature branch, to further verify the changes, but we are not there yet.
Automatic testing
When there is a build process in place, you can start adding extra tasks to it in an attempt to shift left (the process of finding bugs earlier in the CI/CD cycle). You want to have more and more confidence that your code is still working as expecting. To verify that, there are multiple ways of doing so.
One of the ways is including tests that can run in the build pipeline that will verify the code. We group these tests under the name ‘test automation’. There are multiple layers of test that you can run:
|Name|Characteristics|Description|
|—|—|—|
|Unit testing|Fast and cheap|Testing at the lowest level of an application, for example if Add(a+b) works with a=1 and b=-1|
|Integration testing|Slower and less cheap|Testing points in the application where layers of abstraction meet, for example at the controller level in an MVC application|
|End to end testing|Slowest and most expensive|Executing the application like a user would: by click through the functionality|
|Manual testing|Hard to automate|Often based on a feeling if something works|
Dependency checks
An important check to add to your CI pipeline is to check your dependencies for issues. Looking at a modern application, you learn that 99% of code isn’t yours. We are using dependencies everywhere because someone else has already solved a problem for us, and we don’t want to reinvent the wheel: we need to focus on adding value to our product.
The thing is: there are so many dependencies it is hard to keep them up to date. And why would you if they are working as they currently are? Well, sometimes issues are found with the version you are using. Something could have happened to the dependency where a vulnerability was found, or maybe even misused and someone injected additional software in the dependency.
This is where dependency scanning comes in. There are a lot of different options and offerings around. GitHub has Dependabot that scans your code for versions of the dependency and it’s known issues against the CVE database (Common Vulnerability and Exposures). There are container scanners that offer the same for your container dependencies. You can include WhiteSource, BlackDuck and other tools in your pipeline to at least check the dependencies for know issues.
Most of the offerings also include a license check against the dependency. Depending on the application you are working on, a license like the GPL might be a big (legal) issue in your organization to use. You really want to include a step in your CI pipeline that checks those items and fails the build when a dependency is used with a license you don’t want to support in your organization.
Dependency updates
After adding dependency scanning to your pipeline, a next step is to also update those dependencies regularly. Some teams have resolved to someone who runs all the updates every second Wednesday of the month. I like to wake up and see that an update was already checked for, a new branch for it created and already pushed to my repository, with a Pull Request to boot that already has ran all automatic checks to verify that:
- the build still works
- tests automation still works (so no regressions)
- there is no known vulnerability in the dependencies The only thing left to do is approving the Pull Request, which some teams even do automatically: how easy can you make it on yourself?
Tools like NuKeeper already have it available for the hosted versions of GitLab, Azure DevOps, GitHub and BitBucket for the .NET (Core) framework. I’m working on getting the update part as automated as well and sharing that setup here, with for starters support for NPM and NuGet updates against a private GitLab environment.
Static Code Analysis
After automating your build another step to take is including Static Code Analysis. Tools like SonarQube, HPE Fortify or GitHub’s CodeQL are very well known and used products.
With Static Code Analysis you run an analyzer on your code to scan for known patterns. Most products have a set of patterns to use that can be extended when needed. The scan will find violations against the patterns and alert them to you. Most of them can then fail the build and additionally annotate a Pull Request for you, in an effort to prevent those violations to even become part of your code base (shift left).